The disability gap 2018 presents a snapshot of life for disabled New Zealanders and includes some key facts about their work, social, and economic lives.
A downloadable PDF is available
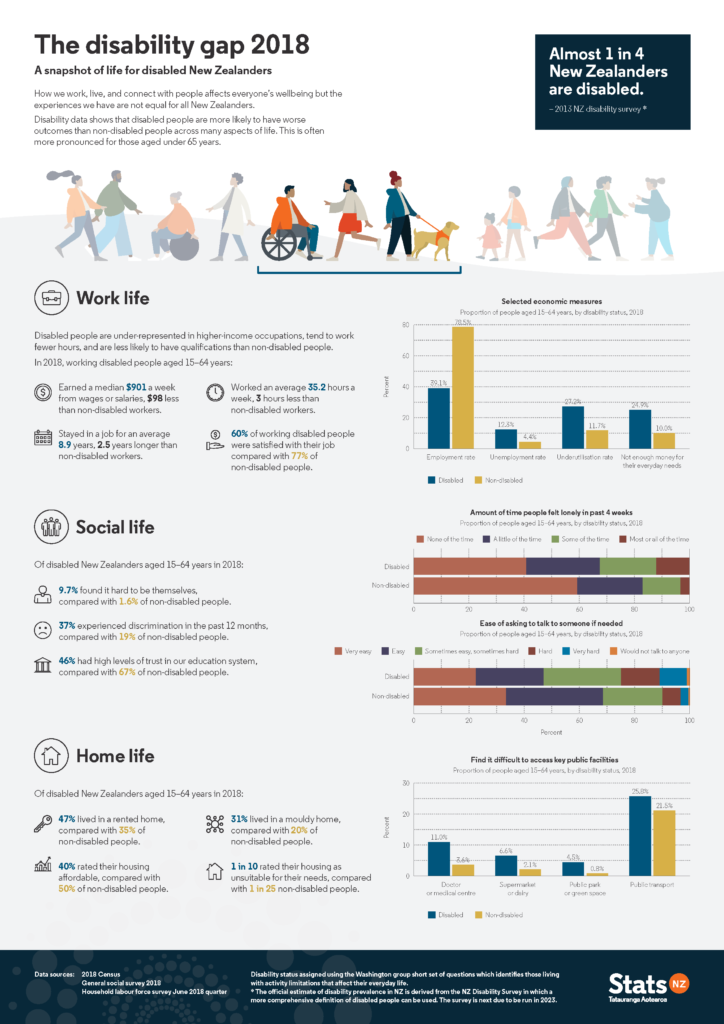
A snapshot of life for disabled New Zealanders.
Almost 1 in 4 New Zealanders are disabled (2013 NZ disability survey*)
How we work, live, and connect with people affects everyone’s wellbeing but the experiences we have are not equal for all New Zealanders.
Disability data shows that disabled people are more likely to have worse outcomes than non-disabled people across many aspects of life. This is often more pronounced for those aged under 65 years.
Work life
Disabled people are under-represented in higher-income occupations, tend to work fewer hours, and are less likely to have qualifications than non-disabled people.
In 2018, working disabled people aged 15–64 years:
- Earned a median $901 a week from wages or salaries, $98 less than non-disabled workers.
- Worked an average 35.2 hours a week, 3 hours less than non-disabled workers.
- Stayed in a job for an average 8.9 years, 2.5 years longer than non-disabled workers.
- 60 percent of working disabled people were satisfied with their job compared with 77 percent of non-disabled people.
Column graph of selected economic measures (proportion of people aged 15–64 years, by disability status, 2018) shows that for disabled people compared with non-disabled people:
- The employment rate was 39.1 percent, compared with 78.5 percent.
- The unemployment rate was 12.3 percent, compared with 4.4 percent.
- The underutilisation rate was 27.2 percent, compared with 11.7 percent.
- 24.9 percent did not have enough money for their everyday needs, compared with 10.0 percent.
Social life
Of disabled New Zealanders aged 15–64 years in 2018:
- 9.7 percent found it hard to be themselves, compared with 1.6 percent of non-disabled people.
- 37 percent experienced discrimination in the past 12 months, compared with 19 percent of non-disabled people.
- 46 percent had high levels of trust in our education system, compared with 67 percent of non-disabled people.
Horizontal bar graph of Amount of time people felt lonely in past 4 weeks (proportion of people aged 15–64 years, by disability status, 2018) shows that disabled people were more likely than non-disabled people to have been lonely in the last 4 weeks.
Horizontal bar graph of Ease of asking to talk to someone if needed (Proportion of people aged 15–64 years, by disability status, 2018) shows that disabled people were more likely than non-disabled people to find it hard to talk to someone.
Home life
Of disabled New Zealanders aged 15–64 years in 2018:
- 47 percent lived in a rented home, compared with 35 percent of non-disabled people.
- 31 percent lived in a mouldy home, compared with 20 percent of non-disabled people.
- 40 percent rated their housing affordable, compared with 50 percent of non-disabled people.
- 1 in 10 rated their housing as unsuitable for their needs, compared with 1 in 25 non-disabled people.
Column graph of Find it difficult to access key public facilities (Proportion of people aged 15–64 years, by disability status, 2018) shows that for disabled people compared with non -disabled people:
- 11.0 percent found it difficult to access a doctor or medical centre, compared with 3.6 percent.
- 6.6 percent found it difficult to access a supermarket or dairy, compared with 2.1 percent.
- 4.5 percent found it difficult to access a public park or green space, compared with 0.8 percent.
- 25.8 percent found it difficult to access public transport, compared with 21.5 percent.
Data sources:
2018 Census
General social survey 2018
Household labour force survey June 2018 quarter